Case Study: Designing a visual data pipelines platform
Role: Lead product designer (collaborated with another product designer, PM and Engineering)
Year: 2023
What is Quix?
Quix is a platform that enables developers and data engineers to build, deploy, and manage real-time data pipelines using streaming technologies like Kafka. It provides a visual interface for managing pipelines, stream processing, and real-time ML models, reducing the complexity of working with distributed systems.
Problem
While stream-based architectures are powerful, they are notoriously hard to work with:
- Debugging pipelines is complex and often CLI-based
- Understanding dependencies across topics and processors requires deep Kafka expertise
- Many tools expose the raw model but offer poor visibility on real-time state and data flow
- Our challenge was to design an intuitive UI that makes stream processing accessible, helping engineers visualize, build, and operate pipelines with confidence.
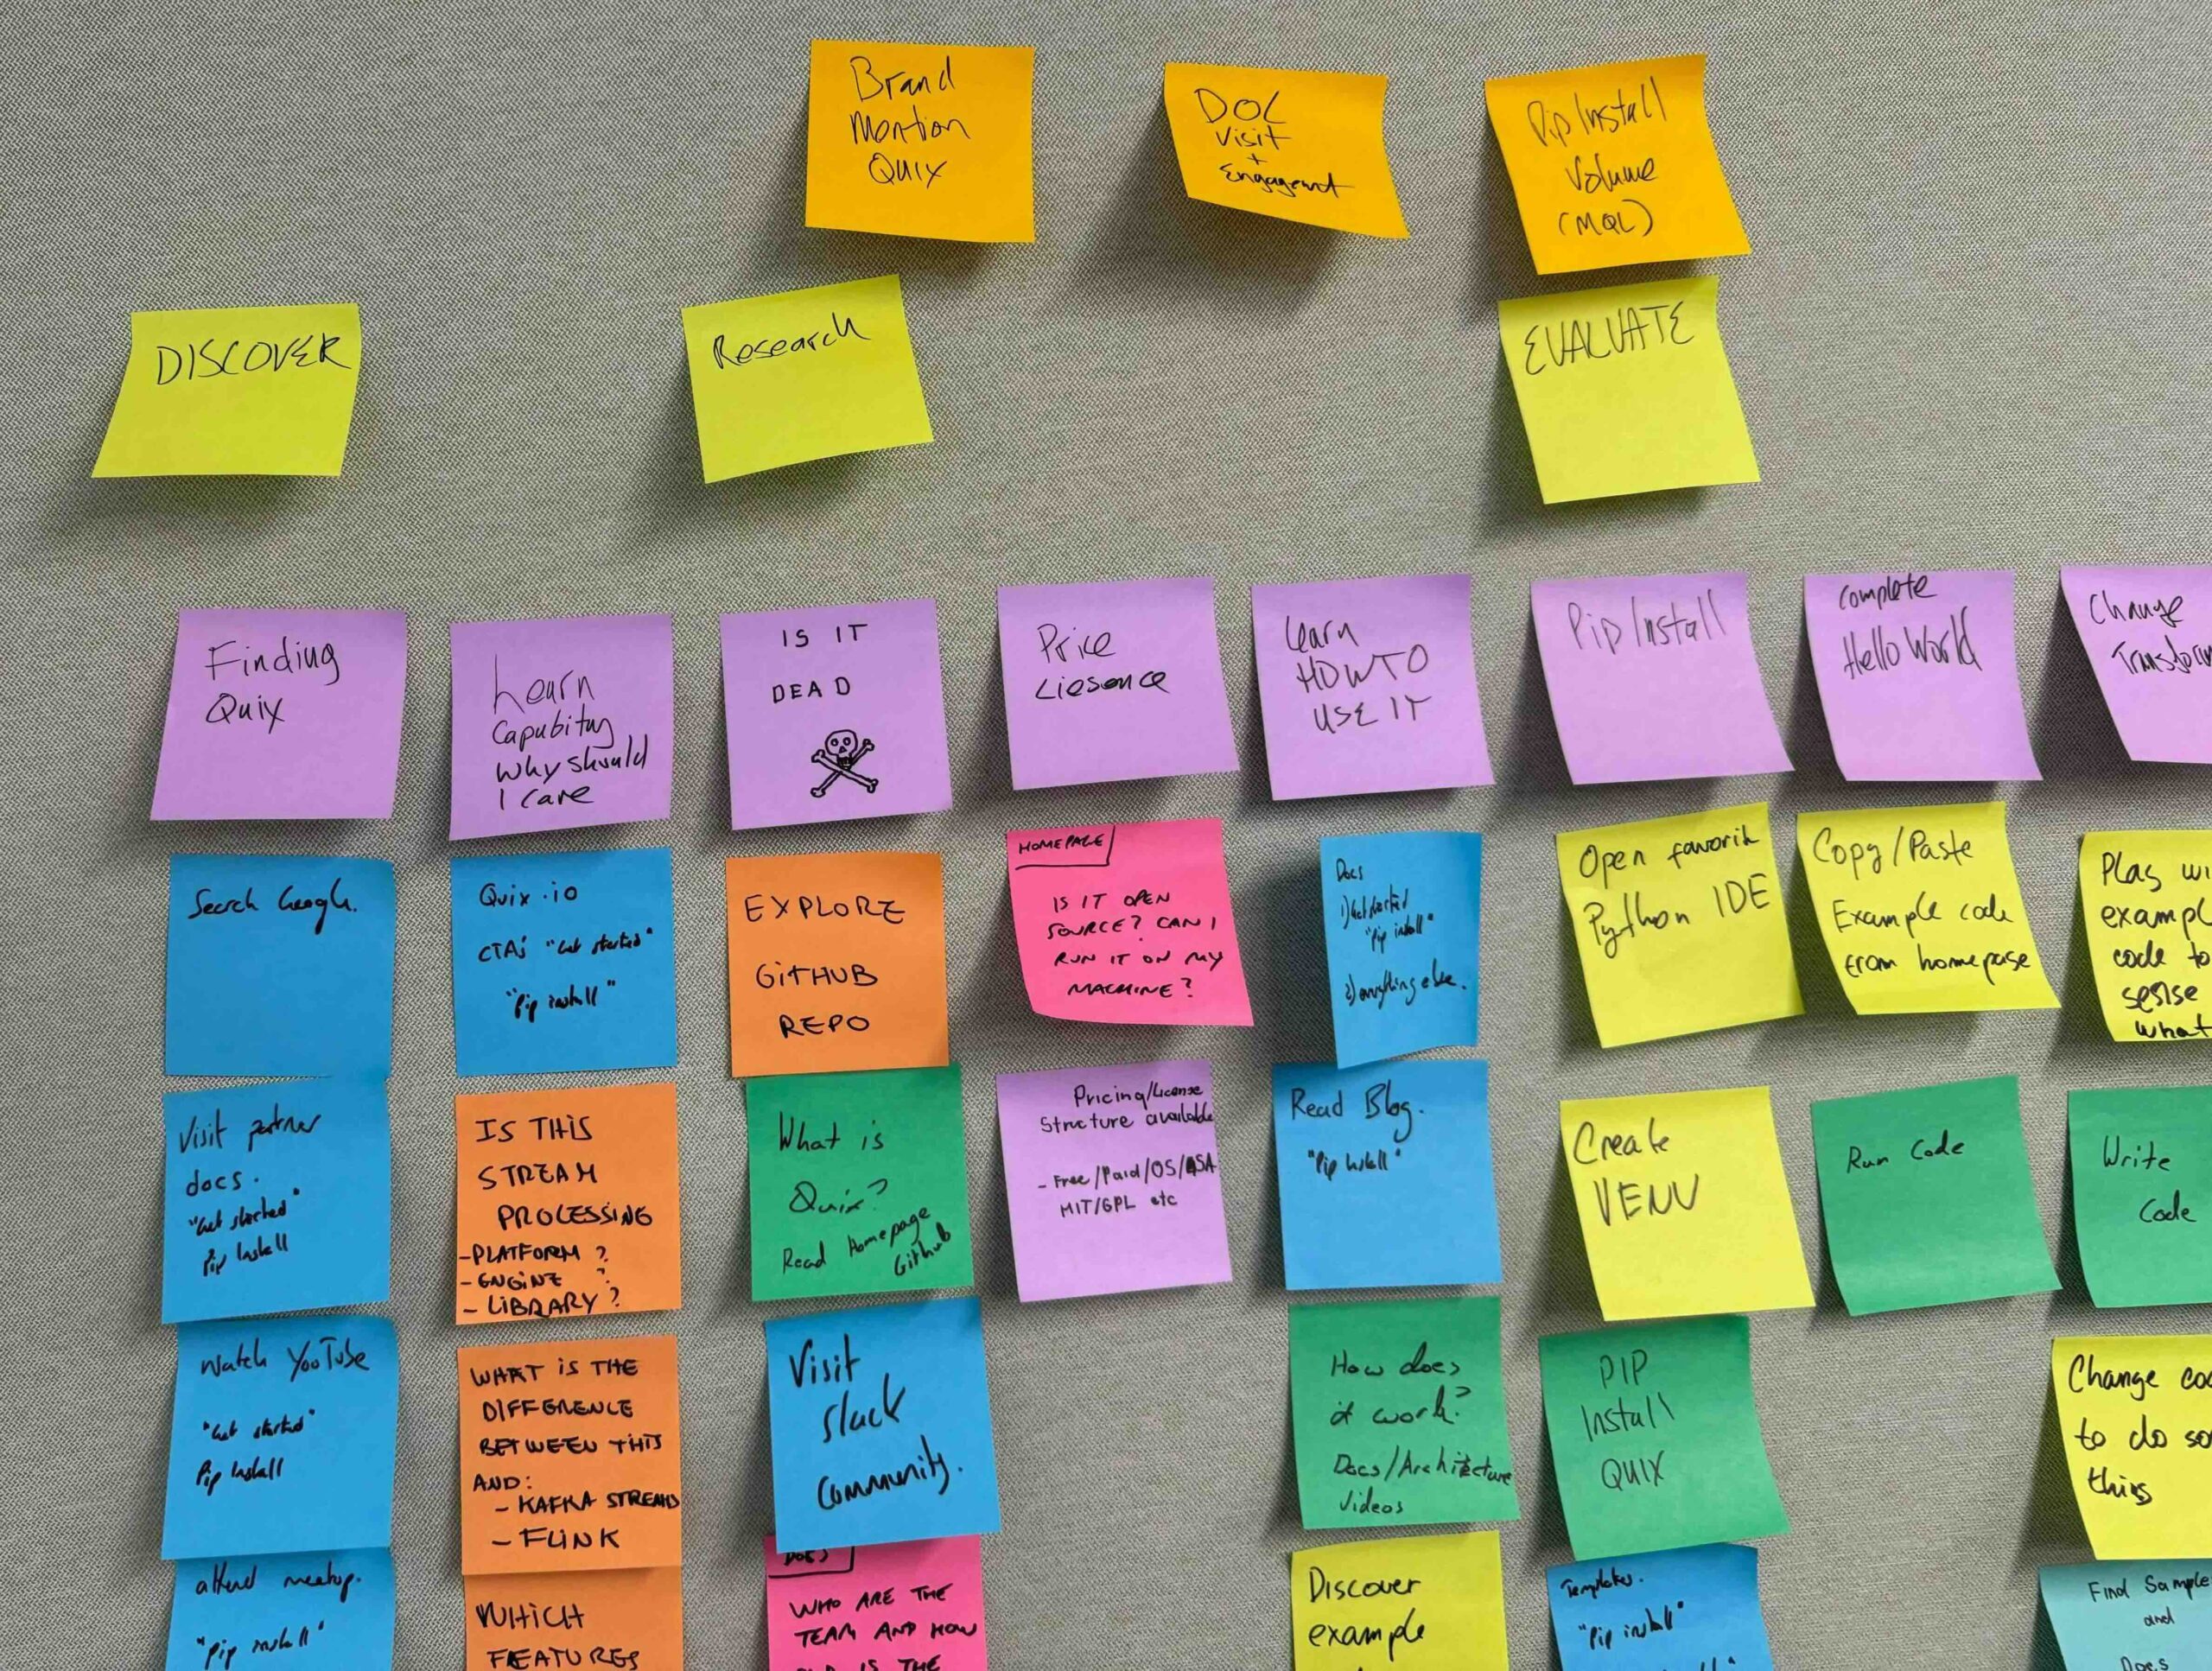
Process & Design Highlights
- Worked closely with PM, data engineers, and the Quix founding team to define UX principles for the platform
- Designed the core Pipeline editor: a visual canvas for building streaming data flows
- Created scalable interaction patterns for complex operations: connecting topics, editing processors, managing versions
- Designed feedback mechanisms: surfacing errors, pipeline status, resource usage
- Supported real-time stream inspection and message debugging workflows
- Helped evolve visual language and component system across the platform
Key takeaways/ use cases:
- Shipped the initial version of the Quix visual pipeline editor, now used by customers in production
- Reduced the time required to create and debug new pipelines
- Made it easier for non-Kafka-expert engineers to collaborate on stream processing
- Supported platform adoption across both small teams and enterprise users
Tools & stack
Figma, Kafka, Kubernetes, Quix backend APIs, React
What I Learned
This project deepened my understanding of data engineering workflows, and how to design visual abstractions for complex, distributed systems. It taught me how to balance power and simplicity in UX,making advanced capabilities accessible to a broader engineering audience.
Features drill down
Making stream processing visual and intuitive
The Quix Pipeline Editor transforms complex streaming architectures into an interactive visual canvas, helping engineers understand, build, and operate their Kafka-based pipelines with clarity.
Instead of relying on CLI commands or raw YAML, users can now design and inspect their pipelines in a fully visual flow:
- See data sources, processors, and sinks at a glance
- Monitor resource usage and pipeline state in real time
- Instantly spot errors or failed nodes in large streaming graphs
- By surfacing the right level of context (statuses, versioning, message throughput), the editor supports both simple use cases and highly advanced pipelines.
This design empowers teams to collaborate across roles, making it easier for data engineers and developers alike to work with streaming data and accelerate time-to-production.
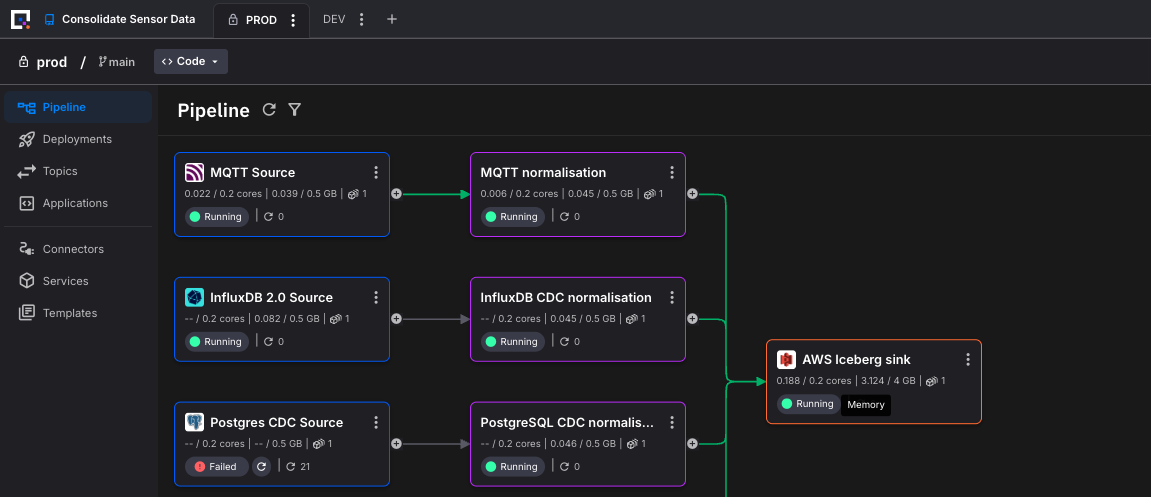
The pipeline
An interactive editor that makes complex Kafka data pipelines visual, explorable, and intuitive to operate.
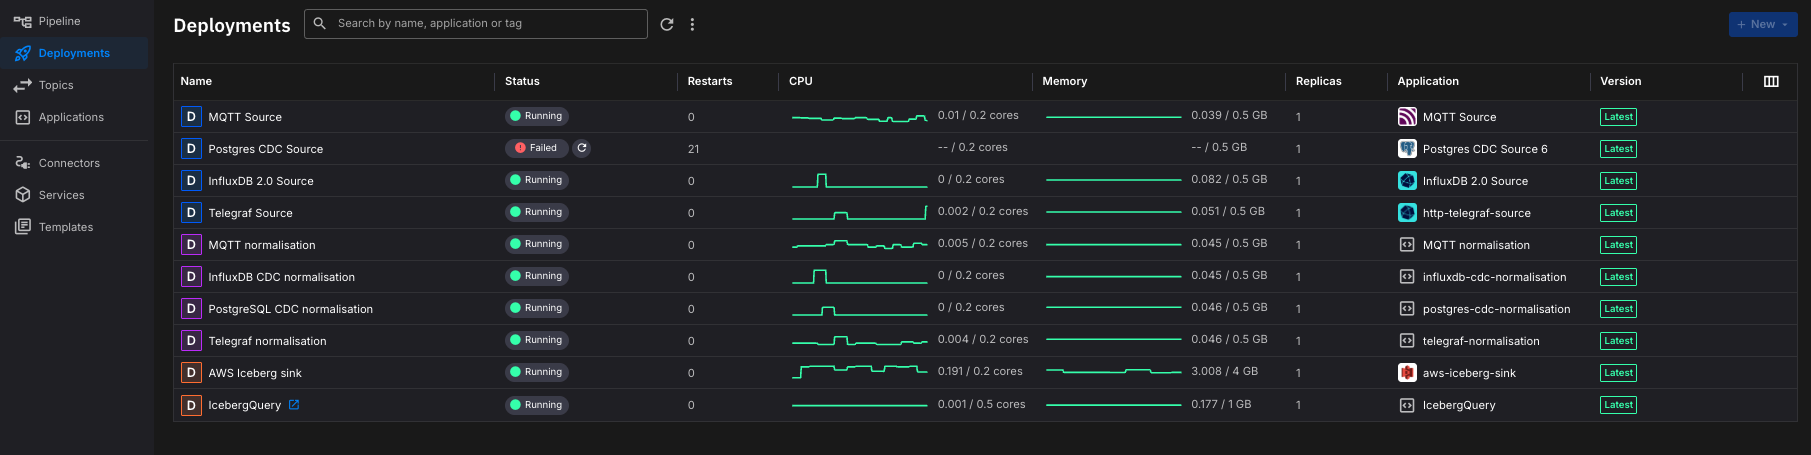
The deployment details view
A control center for monitoring live pipeline deployments. This view surfaces critical information, run state, resource consumption (CPU & memory), replicas, and version, at a glance. I designed the table to scale for large deployments, with intuitive visual cues (status icons, usage graphs) and actionable details. Engineers can quickly identify unhealthy components, optimize resource usage, and drill into individual deployments for deeper diagnostics.
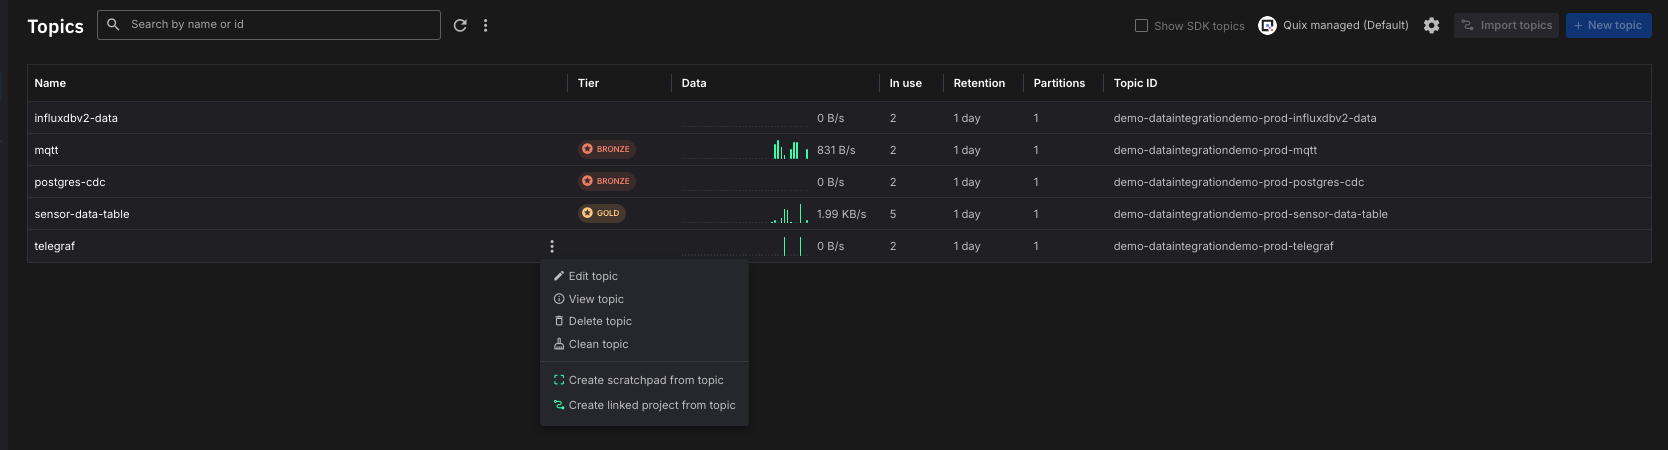
Topics explorer
The topics explorer to give engineers full visibility and control over their Kafka topics without needing to switch to external tools. In this view, users can inspect topic metadata, track throughput and retention, and manage partitions.
We prioritized clarity and operational safety: actions like cleaning or deleting a topic are surfaced with contextual cues, while real-time stats help teams monitor message flow across the pipeline.
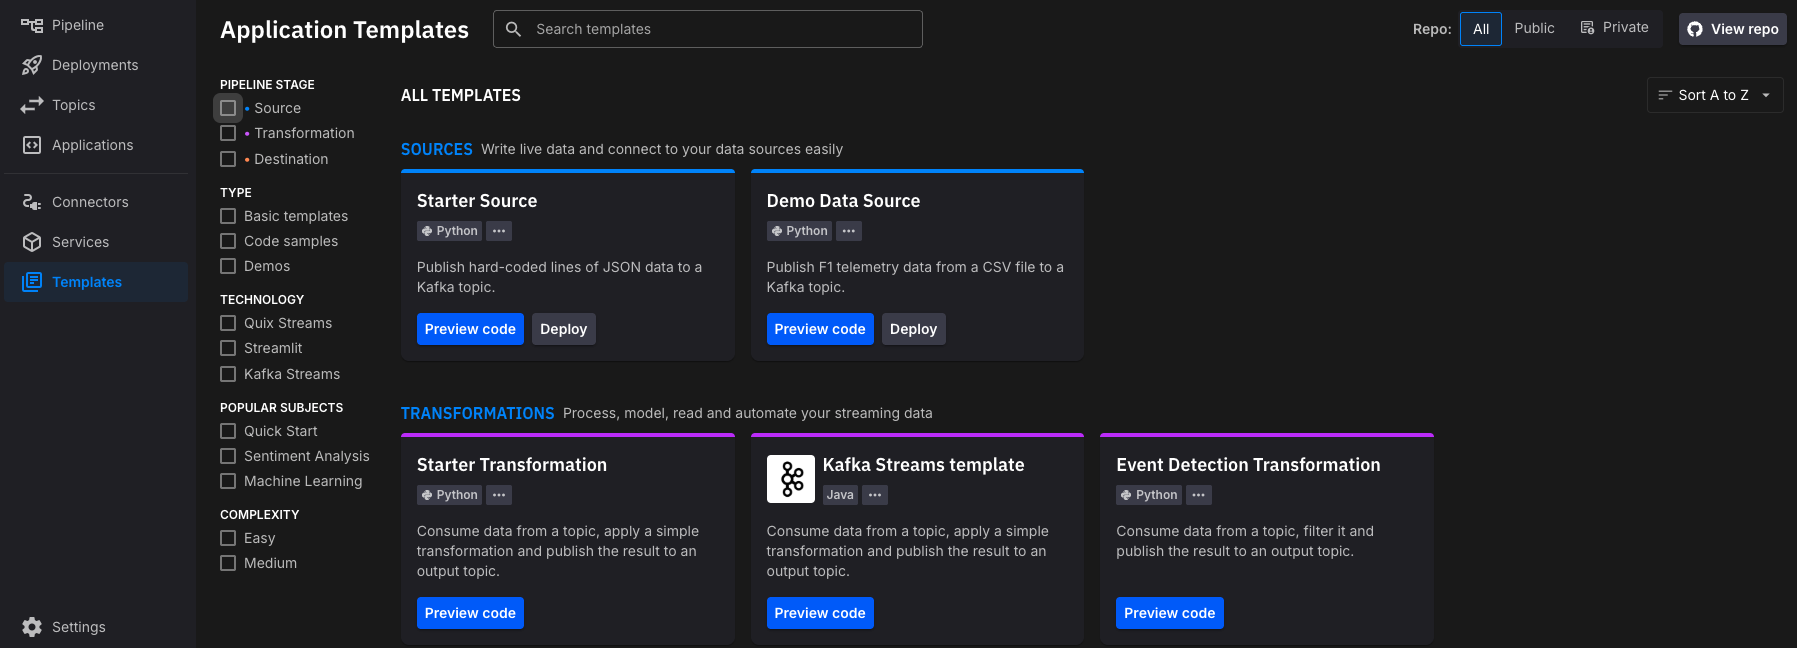
Applications templates
To help users get started faster, I designed the Application Templates view to surface pre-built components for common streaming use cases. Whether it’s sourcing data, transforming it, or writing to a destination, users can deploy templates in one click, or preview the code to customize.
I focused on clarity and discoverability: templates are grouped by pipeline stage and complexity, with filtering to match a wide range of technical backgrounds. This made the platform much more approachable for both data engineers and app developers.
andreachomiak@gmail.com | LinkedIn
© 2025 Andrea Chomiak