Case Study: Website monitoring
Role: I led the UX design, shaping the information architecture, core interaction patterns, and visual hierarchy for the website monitoring feature set.
Year: 2025
What is web moniring?
Web monitoring is a feature designed to help developers analyze and debug user experience issues on their websites, using OpenTelemetry-native telemetry. Integrated within a broader observability tool, it connects data across sessions, page views, HTTP requests, errors, and traces giving developers actionable context when things go wrong.
Problem
Traditional observability tools for backend systems were not well suited to web applications. Developers struggled to correlate frontend telemetry with backend traces, errors, and user sessions.
Teams were spending too much time switching between tools, guessing what users experienced, and piecing together the story manually.
Process & Design Highlights
- Co-led feature discovery with engineers and product stakeholders
- Defined a unified interaction model across page views, sessions, errors, and events
- Designed an exploration flow to allow seamless pivoting between different telemetry types
- Created visual models to represent user journeys and surface performance bottlenecks
- Developed consistent side panel patterns to minimize context switching
- Wrote technical documentation to explain the data model and how to interpret it
Outcome & Impact
The Web Monitoring feature was tested with early customers and launched as a core part of our observability platform. It is now used by engineering teams to debug user experience issues across production web apps.
- Reduced time to correlate frontend and backend telemetry
- Lowered the barrier for understanding web performance metrics and user journeys
- Helped teams proactively identify and fix high-impact frontend issues before users report them
Key takeaways/ use cases:
- Use Web Monitoring to trace user journeys across pages and sessions
- Identify performance issues such as slow pages or layout shifts
- Correlate frontend errors and HTTP requests with backend traces
Tools & stack
Figma, Custom telemetry SDKs, OpenTelemetry, Posthog, Prometheus.
What I Learned
This project deepened my understanding of how frontend telemetry connects to broader system observability. I learned how to design multi-path exploration flows that allow engineers to pivot between different data types while maintaining context.
Feature drill down
Connecting the dots across the web telemetry stack
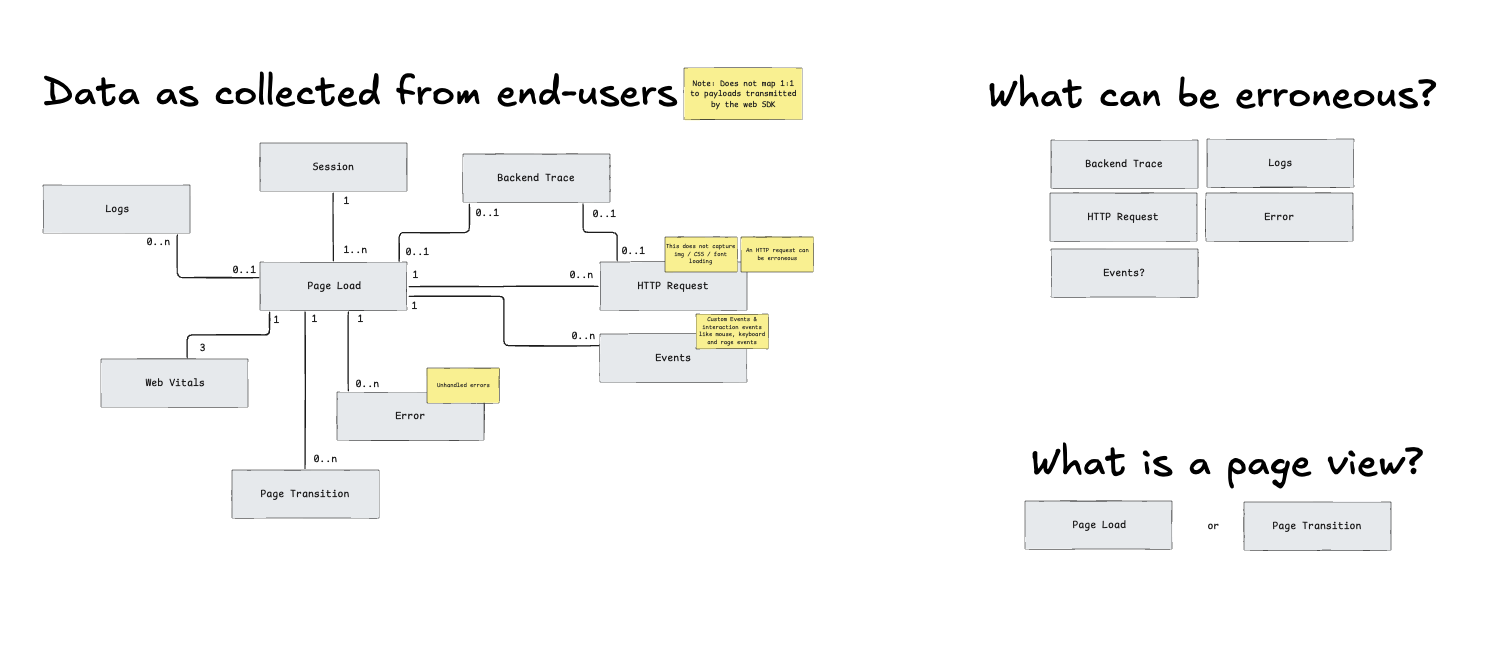
Mapping the signals behind user experience
Telemetry without context is noise. Web Monitoring brings structure to that noise linking frontend and backend signals into a cohesive debugging experience.
This feature was designed to match how engineers think: starting from a real-world problem (a slow page, a spike in errors), then following its path across sessions, page views, HTTP requests, and backend traces. The UI encourages fluid exploration helping teams move from surface symptoms to root cause with minimal friction resulting in faster answers, higher confidence, and a product that feels like an extension of the developer’s thinking not a wall of disconnected data.
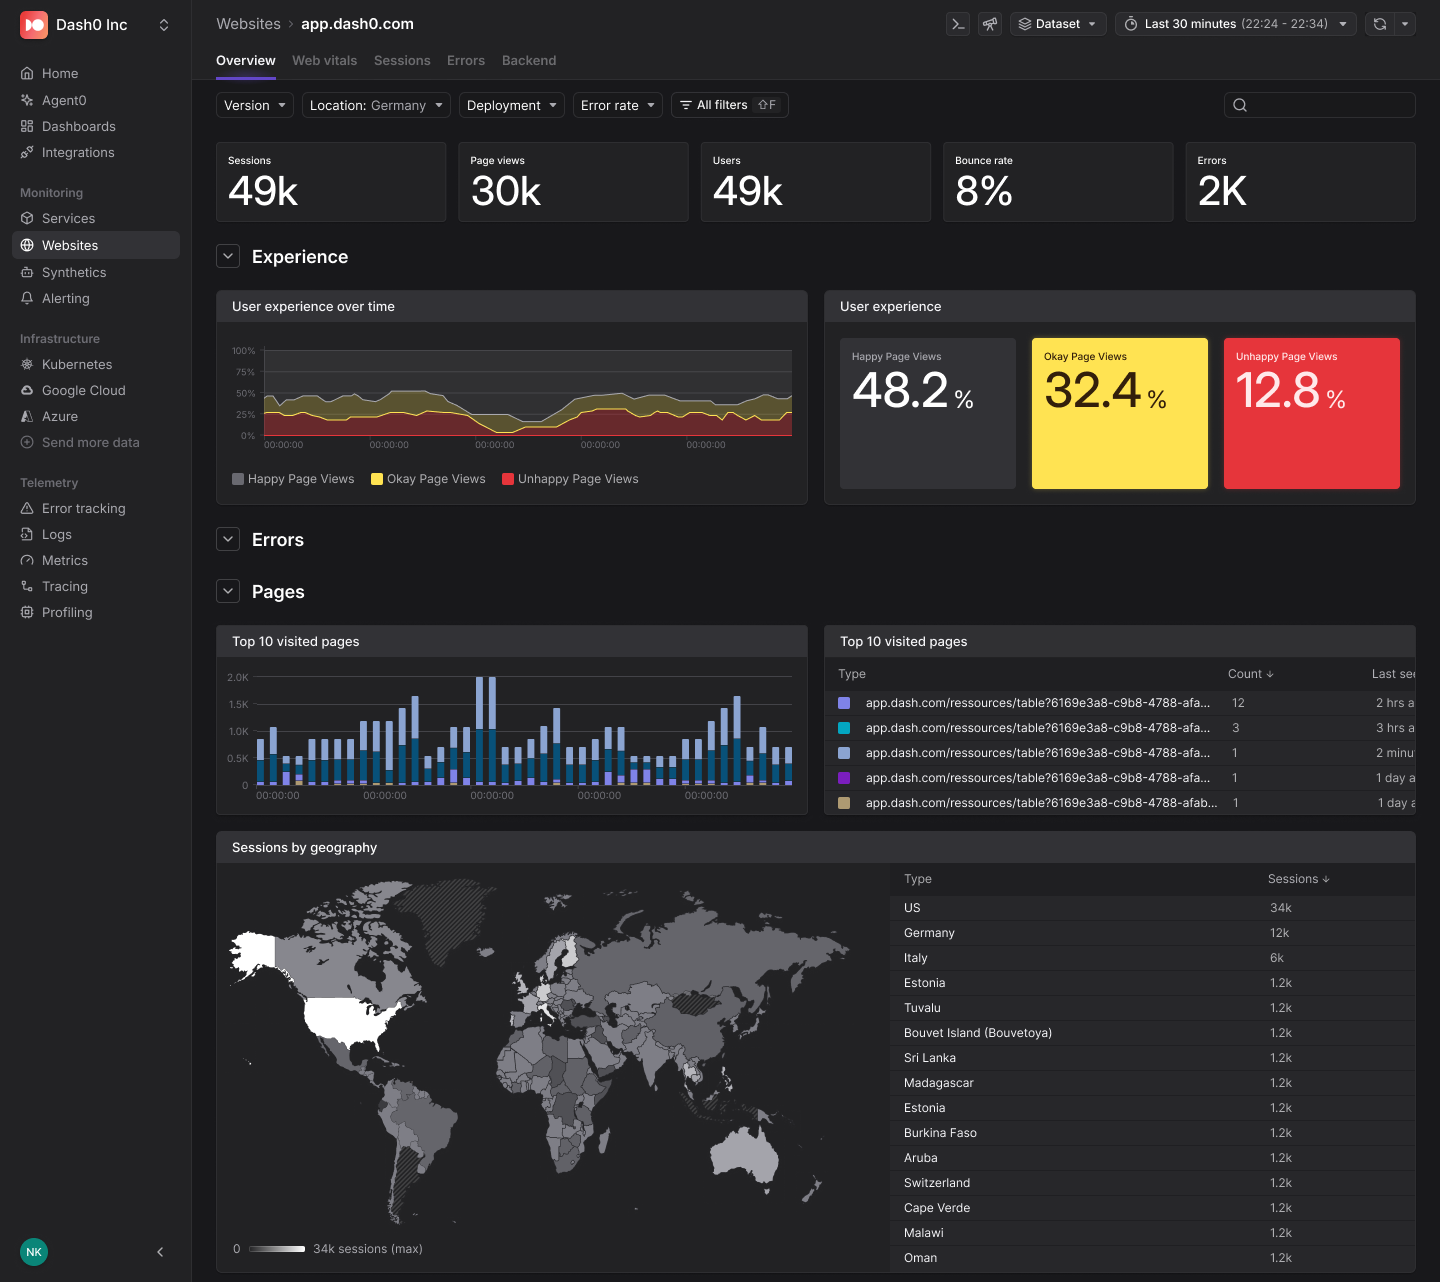
From vitals to insights: helping teams debug what matters
Web monitoring follows a system where developers and PMs can easily navigate web vitals, sessions, errors, and pages enabling faster decisions and actionable insights.
We designed the Web Monitoring feature to give developers a fast, intuitive way to move across key dimensions of web experience. Each tab is built to surface what matters most no unnecessary clicks, no losing context. You can pivot from performance insights to user behavior and error impact in a few seconds. It’s about turning telemetry into a conversation developers can follow.
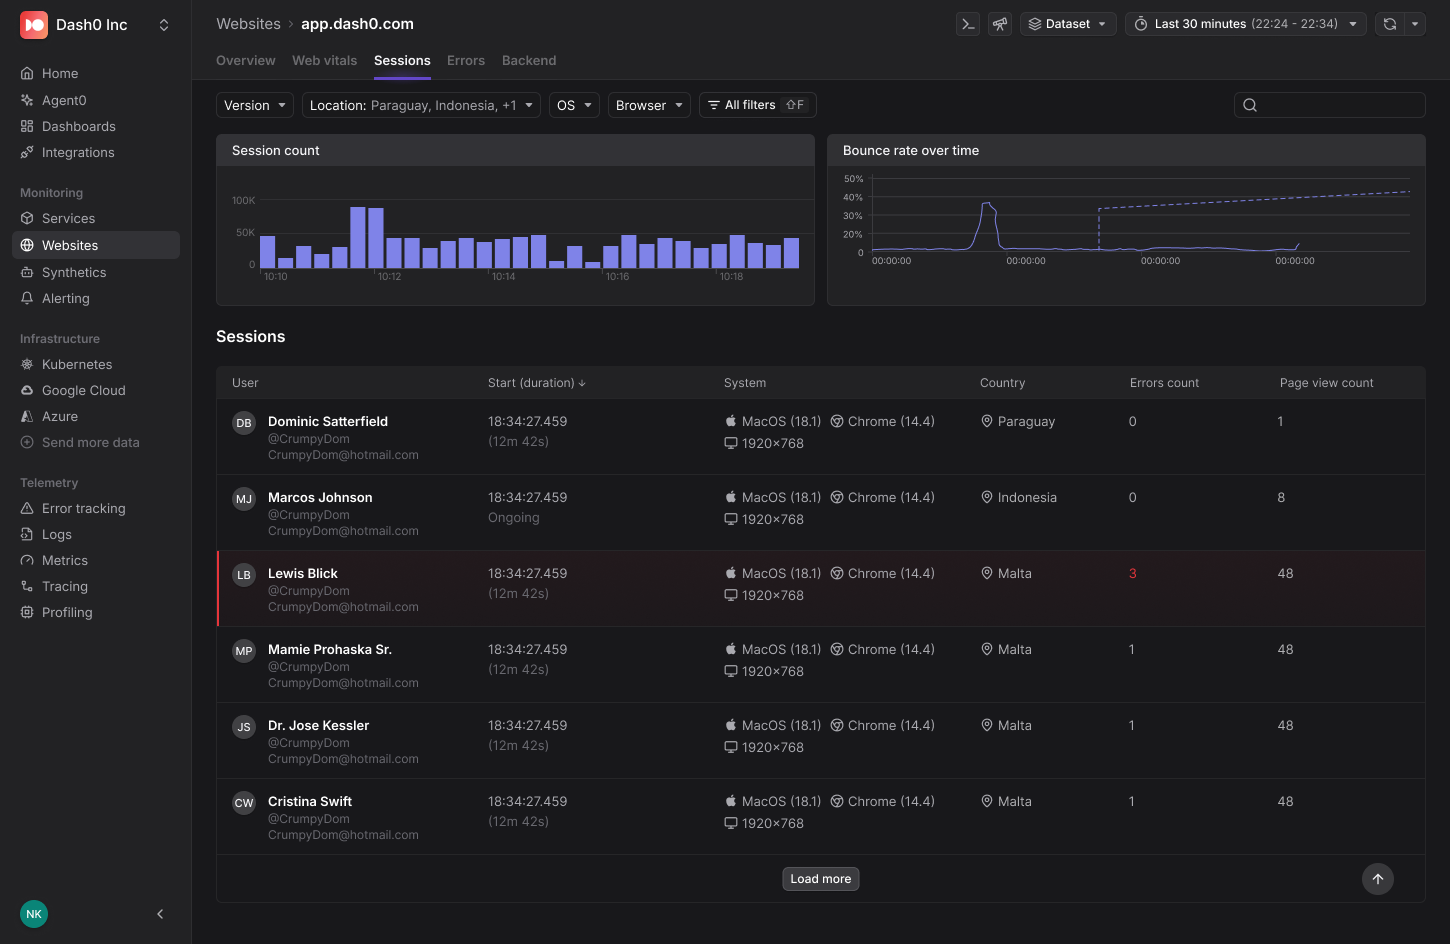
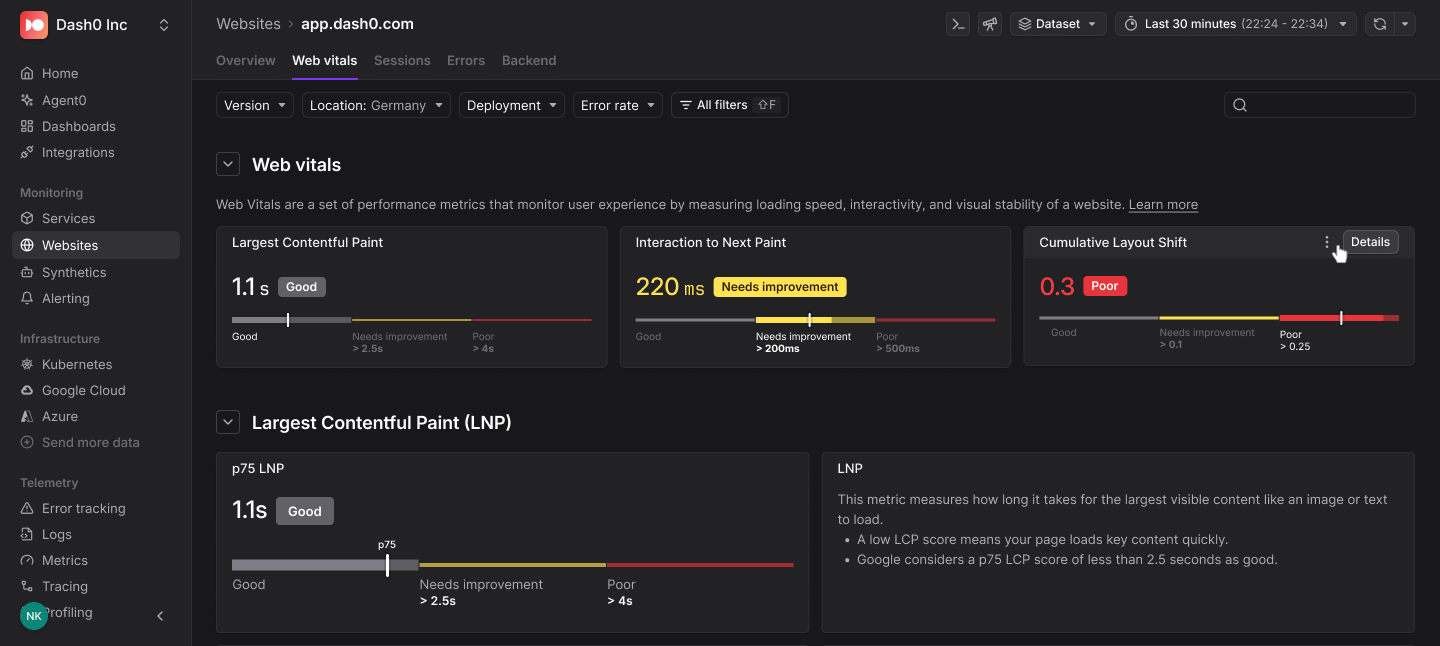
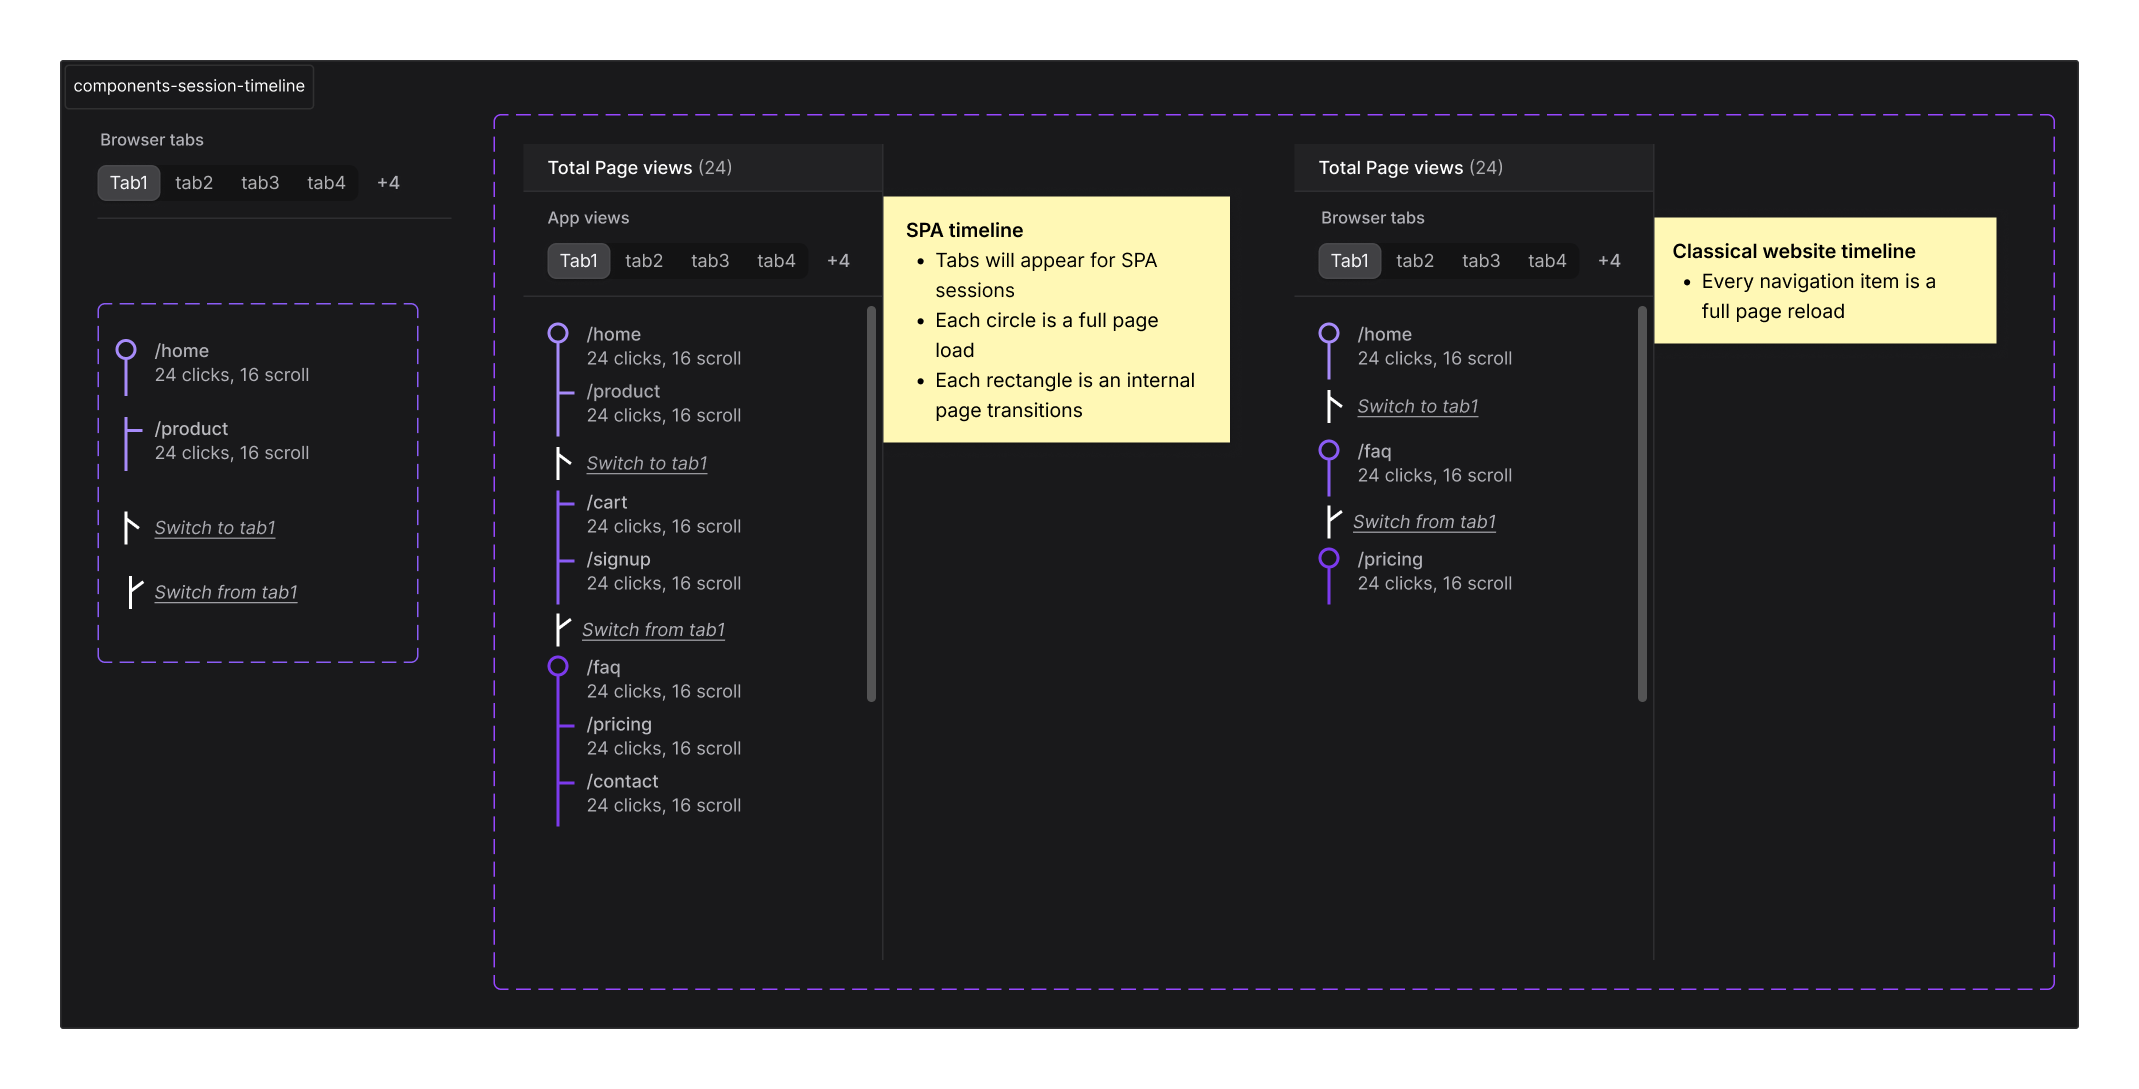
Visualizing user navigation, across any web architecture
I designed this flexible session timeline to adapt to both Single Page Applications (SPA) and traditional multi-page websites.
- For SPAs, it shows page loads and in-app transitions (circles & rectangles).
- For classical sites, it displays full page reloads only.
This gives developers a unified, visual way to understand how users navigate regardless of how their app is built.
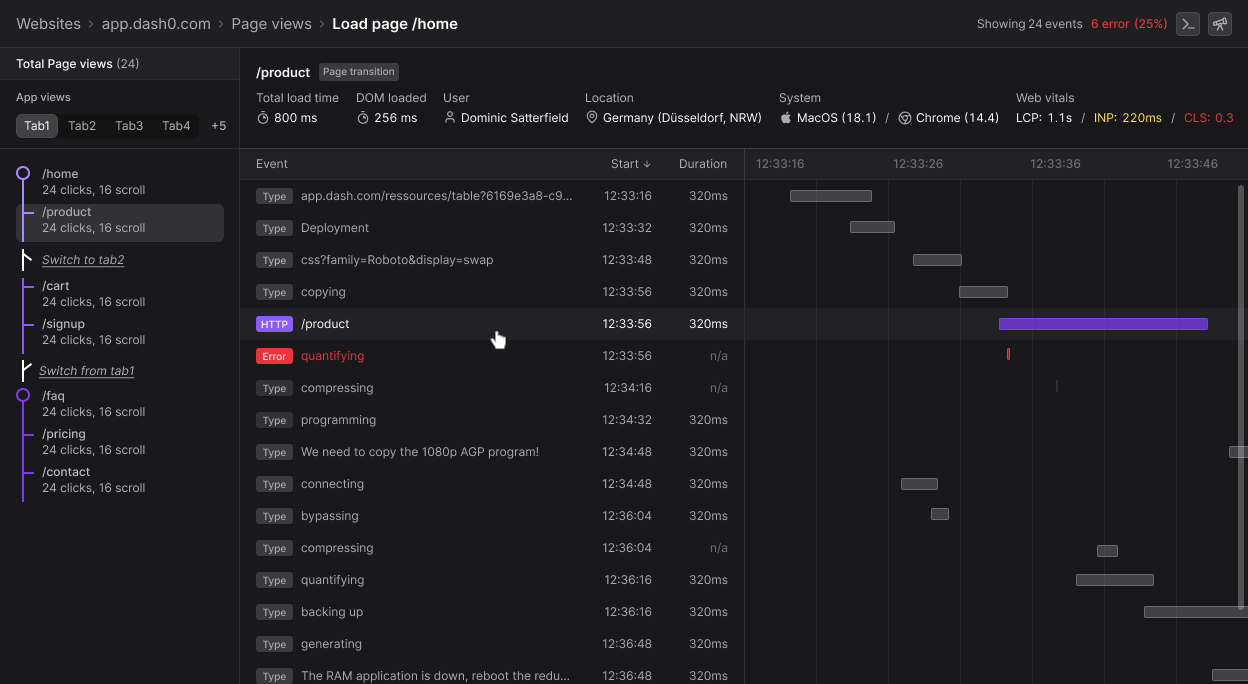
This timeline helps developers quickly understand what happens during a single page load: which resources were fetched, when errors occurred, and how interaction and network timing impacts user experience. Designed for clarity, so engineers can spot slow points or broken elements at a glance.
andreachomiak@gmail.com | LinkedIn
© 2025 Andrea Chomiak